
Risk-based testing: check your scores against escaped defects
Take a QA lead whose team uses risk-based testing to plan each sprint. Every story gets a risk score, the team tests the high scorers first, and the low scorers…
You have read this


A search test can return the right products while taking too long to serve the customer. Checking the items on screen does not measure that delay.
Marie Cruz's September 14 Ministry of Testing definition describes performance checks that recur during development and after release. The worksheet below is a proposed way to build a small recurring check. It is not a method reported by Cruz, and no measurements have been taken for this example.
Suppose a shop changes its search index, which helps the service find products in its catalog. Your existing test checks that a search returns the expected items. You now want to compare how long those searches take before and after the change.
Choose queries that reflect the task you care about. Include the data needed to check their results. Save the queries and data so another tester can use the same inputs. A random query against a changing catalog will be harder to compare later.
The test also needs a reason for its pass criteria. Agree with the service owner how long users can wait and which errors count as failures. Record the measure and the conditions where that limit applies. A time limit copied from another product may not fit this task.
The workload describes what you ask the system to do and when you ask it. Use this worksheet before collecting a baseline.
| Condition | What to record | Why it affects the comparison |
|---|---|---|
| Catalog | Dataset version and size | More products may change the work needed for a search. |
| Queries | Exact queries and their share of requests | Some queries may cost more to process than others. |
| Request timing | Arrival pattern and how users overlap | A service may slow down when requests compete for resources. |
| Test length | Warm-up period and measured period | Starting and steady activity may give different results. |
| Environment | Service settings, resources and other active work | Resource changes can affect response times. |
| Cache | Starting state and how it is prepared | Stored results may serve some requests faster. |
| Test tool | Version, settings and machine resources | The load generator must be able to deliver the planned work. |
A cache stores data for reuse. For this check, choose a cache starting state and use the same preparation for each comparison. If you also need to study a cold start, treat that as a separate case. Mixing cold and warm runs makes the result harder to explain.
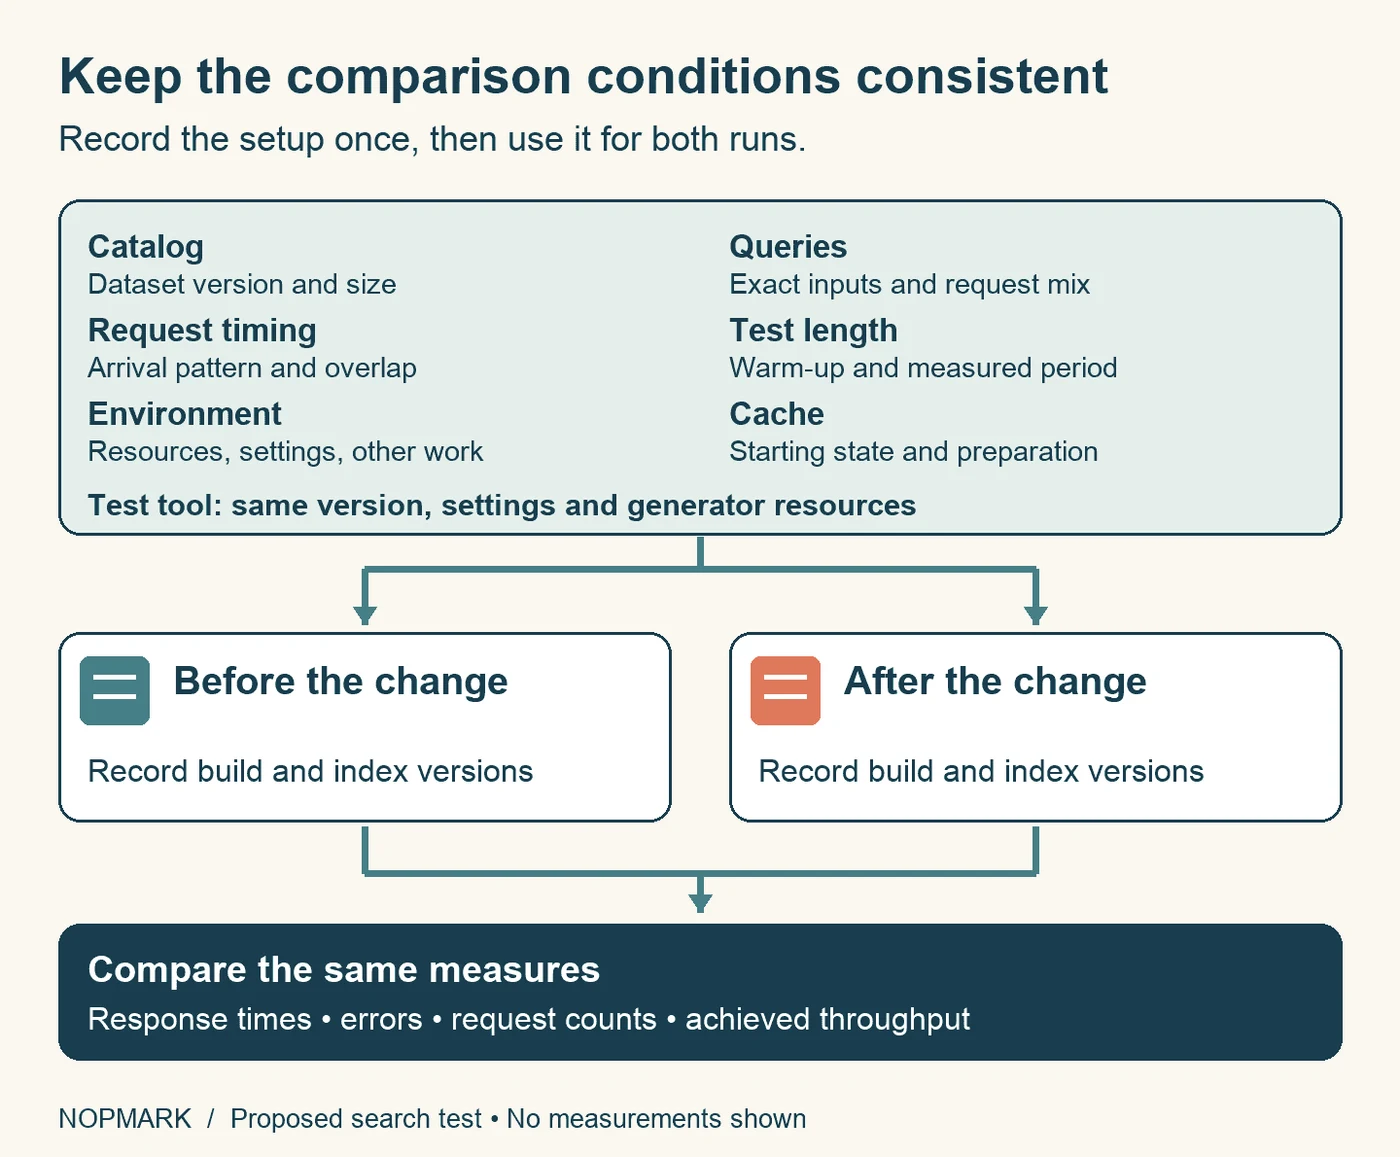 Illustrative setup. Record the build and index versions for each run, and keep the other test conditions consistent.
Record the software build and index version alongside each result. Keep response times for individual requests where feasible, together with errors and request counts. Then use the same measures in both runs.
A median describes the middle response time. A 95th percentile shows a point that 95% of measured response times are at or below. It helps you inspect slower requests that the median can hide. Neither value explains the cause of a change on its own.
Check how many requests finished per second as well. That is achieved throughput. If the tool sent less work in one run, a lower response time may reflect that lighter load. Keep failed requests visible rather than reporting only the speed of successful ones.
| Record | Before the index change | After the index change |
|---|---|---|
| Build and index versions | Not measured | Not measured |
| Workload and environment record | Not recorded | Not recorded |
| Median and 95th percentile response time | Not measured | Not measured |
| Errors and total request count | Not measured | Not measured |
| Achieved throughput | Not measured | Not measured |
| Result against agreed limits | Not evaluated | Not evaluated |
This table is an empty worksheet, not a benchmark. Attach the raw results and setup record when you fill it in.
If the later run is slower, first check whether it used the same conditions. Look for a changed dataset, other work on the server, or a different cache start. Check whether the tool delivered the intended request pattern. Repeat the comparison as needed to understand variation; a fixed repeat count will not suit every system.
A difference that persists under matched conditions gives you a reason to investigate the change. It does not yet identify the slow component. Use logs or other measurements to test a specific explanation, and keep any remaining limits in the report.
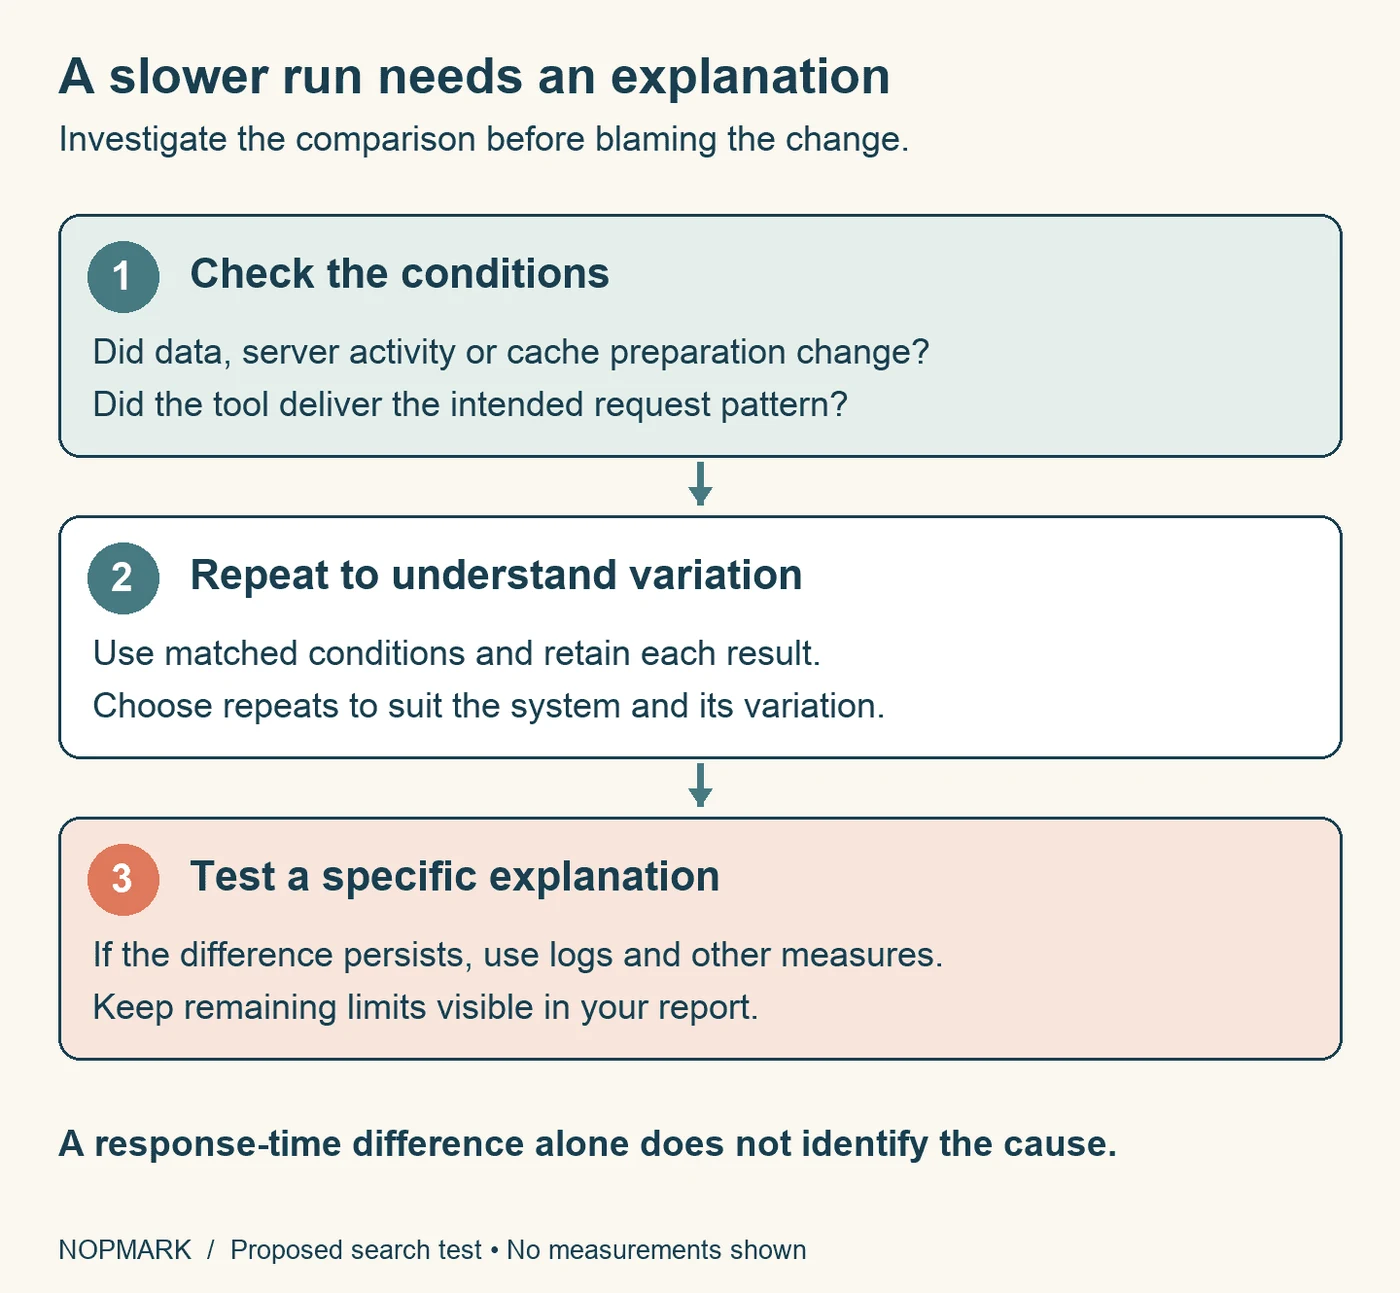 Proposed investigation steps. No runs or measurements are reported in this example.
For foundation study alongside this exercise, use Nopmark's free CTFL assessment to choose topics to practise. It does not assess your practical performance-testing skill.
Save this check with the setup instructions and the change that should trigger it. The next tester should be able to repeat the work and explain what changed between the results.
Take a QA lead whose team uses risk-based testing to plan each sprint. Every story gets a risk score, the team tests the high scorers first, and the low scorers…
You have read this